
- Introduction
- Basis of presentation
- Highlights of the fiscal quarter and fiscal year-to-date results
- Graph 1: Comparison of total authorities and total net budgetary expenditures, Q3 2024–2025 and Q3 2023–2024
- Significant changes to authorities
- Graph 2: Variance in authorities as at December 31, 2024 (in millions of dollars)
- Significant changes to quarter expenditures
- Significant changes to year-to-date expenditures
- Risks and uncertainties
- Significant changes in relation to operations, personnel and programs
- Approved by senior officials:
- Appendix
Date of Publishing:
Introduction
This quarterly report has been prepared by management as required by section 65.1 of the Financial Administration Act and in the form and manner prescribed by the Directive on Accounting Standards, GC 4400 Departmental Quarterly Financial Report. This quarterly financial report should be read in conjunction with the 2024–25 Main Estimates.
This quarterly report has not been subject to an external audit or review.
The National Security and Intelligence Review Agency (NSIRA) is an independent external review body that reports to Parliament. Established in July 2019, NSIRA reviews Government of Canada national security and intelligence activities to assess whether they are lawful, reasonable, and necessary. The Agency also investigates complaints from members of the public on the activities of the Canadian Security Intelligence Service (CSIS), the Communications Security Establishment (CSE), the Royal Canadian Mounted Police (RCMP), as well as certain other national security-related complaints, independently and in a timely manner.
The NSIRA Secretariat supports the Agency in the delivery of its mandate. Independent scrutiny contributes to strengthening the accountability framework for national security and intelligence activities and to enhancing public confidence. Ministers and Canadians are informed whether national security and intelligence activities undertaken by Government of Canada institutions are lawful, reasonable, and necessary
A summary description NSIRA’s program activities can be found in Part II of the Main Estimates. Information on NSIRA’s mandate can be found on its website.
Basis of presentation
This quarterly report has been prepared by management using an expenditure basis of accounting. The accompanying Statement of Authorities includes the secretariat’s spending authorities granted by Parliament and those used by the secretariat, consistent with the 2024–2025 Main Estimates. This quarterly report has been prepared using a special-purpose financial reporting framework (cash basis) designed to meet financial information needs with respect to the use of spending authorities.
The authority of Parliament is required before money can be spent by the government. Approvals are given in the form of annually approved limits through appropriation acts or through legislation in the form of statutory spending authorities for specific purposes.
The Secretariat uses the full accrual method of accounting to prepare and present its annual departmental financial statements that are part of the departmental results reporting process. However, the spending authorities voted by Parliament remain on an expenditure basis.
Highlights of the fiscal quarter and fiscal year-to-date results
This section highlights the significant items that contributed to the net increase or decrease in authorities available for the year and actual expenditures for the quarter ended December 31, 2024.
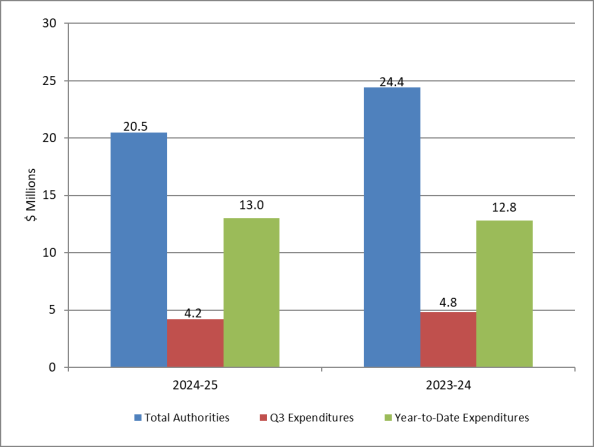
NSIRA Secretariat spent approximately 63% of its authorities by the end of the third quarter, compared with 52% in the same quarter of 2023–2024 (see graph 1).
Graph 1: Comparison of total authorities and total net budgetary expenditures, Q3 2024–2025 and Q3 2023–2024
Text version of Figure 1
| 2024-25 | 2023-24 | |
|---|---|---|
| Total Authorities | $20.5 | $24.4 |
| Q3 Expenditures | $4.2 | $4.8 |
| Year-to-Date Expenditures | $13.0 | $12.8 |
Significant changes to authorities
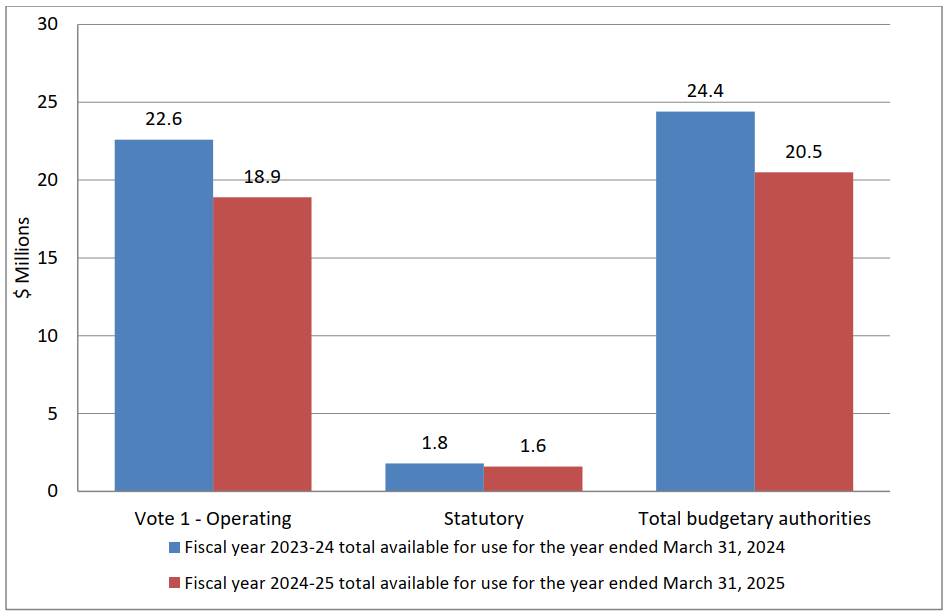
As of December 31, 2024, Parliament had approved $20.5 million in total authorities for use by NSIRA Secretariat for 2024–2025 compared with $24.4 million as of December 31, 2023, for a net decrease of $3.9 million or 16.1% (see graph 2).
Graph 2: Variance in authorities as at December 31, 2024 (in millions of dollars)
Text version of Figure 2
| Fiscal year 2023-24 total available for use for the year ended March 31, 2024 | Fiscal year 2024-25 total available for use for the year ended March 31, 2025 | |
|---|---|---|
| Vote 1 – Operating | 22.6 | 18.9 |
| Statutory | 1.8 | 1.6 |
| Total budgetary authorities | 24.4 | 20.5 |
The decrease of $3.9 million in authorities is mostly due to the end of several infrastructure projects that had required substantial funding in 2023-2024. No equivalent projects have been planned for 2024-2025, leading to a natural decrease in the authorizations allocated to this expenditure.
Significant changes to quarter expenditures
The third quarter expenditures totalled $4.2 million for a decrease of $0.6 million compared to $4.8 million spent during the same period in 2023–2024. Table 1 presents budgetary expenditures by standard object.
Table 1: Departmental budgetary expenditures by Standard Object (unaudited)
| Variances in expenditures by standard object (in thousands of dollars) | Fiscal year 2024–25: expended during the quarter ended December 31, 2024 | Fiscal year 2023–24: expended during the quarter ended December 31, 2023 | Variance $ | Variance % |
|---|---|---|---|---|
| Personnel | 3,584 | 2,866 | 718 | 25% |
| Transportation and communications | 131 | 110 | 21 | 19% |
| Information | 15 | 1 | 14 | 1400% |
| Professional and special services | 437 | 486 | (49) | (10%) |
| Rentals | 40 | 78 | (38) | (49%) |
| Repair and maintenance | 27 | 1,161 | (1,134) | (98%) |
| Utilities, materials and supplies | (11) | (1) | (10) | 1000% |
| Acquisition of machinery and equipment | 0 | 83 | (83) | (100%) |
| Other subsidies and payments | 15 | (33) | 48 | (145%) |
| Total gross budgetary expenditures | 4,238 | 4,751 | (513) | (11%) |
*Details may not sum to totals due to rounding*
Personnel
The increase of $718,000 is attributable to the addition of FTEs to meet increased demand, and to higher average salaries as a result of collective bargaining increases.
Information
The increase of $14,000 is explained by a one-time purchase of name plates and the hiring of a communications consultant.
Rentals
The decrease of $38,000 is explained by a decrease in software maintenance fees.
Repair and maintenance
The decrease of $1,134,000 is due to invoices related to a capital infrastructure project that was completed in 2023-24.
Acquisition of machinery and equipment
The decrease of $83,000 is explained by one-time purchases of application software and device lockers in 2023-24.
Other subsidies and payments
The increase of $48,000 is explained by a change in the timing of salary overpayment recoveries.
Significant changes to year-to-date expenditures
The year-to-date expenditures totalled $13.0 million for an increase of $0.2 million (1%) compared to $12.8 million spent during the same period in 2023- 2024. Table 2 presents budgetary expenditures by standard object.
Table 2: Departmental budgetary expenditures by Standard Object (unaudited) (continued)
| Variances in expenditures by standard object (in thousands of dollars) | Fiscal year 2024–25: year-to-date expenditures as of December 31, 2024 | Fiscal year 2023–24: year-to-date expenditures as of December 31, 2023 | Variance $ | Variance % |
|---|---|---|---|---|
| Personnel | 10,448 | 8,766 | 1,682 | 19% |
| Transportation and communications | 266 | 302 | (36) | (12%) |
| Information | 28 | 5 | 23 | 460% |
| Professional and special services | 2,026 | 2,155 | (129) | (6%) |
| Rentals | 82 | 151 | (69) | (46%) |
| Repair and maintenance | 67 | 1,188 | (1,121) | (94%) |
| Utilities, materials and supplies | 29 | 56 | (27) | (48%) |
| Acquisition of machinery and equipment | 20 | 135 | (115) | (85%) |
| Other subsidies and payments | 56 | 89 | (33) | (37%) |
| Total gross budgetary expenditures | 13,022 | 12,847 | 175 | 1% |
*Details may not sum to totals due to rounding*
Personnel
The increase of $1,682,000 reflects management’s decision to increase FTEs to enhance operational capacity in response to greater demand for output. It is also a result of an increase in average salary due to alignment with increases approved as part of collective bargaining.
Information
The increase of $23,000 is due to increased use of a communications consultant and printing services.
Rentals
The decrease of $69,000 is due to a 3-year pre-paid software licence in 2023-24 and the timing of invoicing for the maintenance fees associated to the financial system.
Repair and maintenance
The decrease of $1,121,000 is due to invoicing for a capital infrastructure project that was completed in 2023-24.
Utilities, materials and supplies
The decrease of $27,000 is due to a decrease in unreconciled acquisition card payments.
Acquisition of machinery and equipment
The decrease of $115,000 is mainly explained by one-time purchases of application software in 2023-24.
Other subsidies and payments
The decrease of $33,000 is explained by a change in the timing of salary overpayment recoveries.
Risks and uncertainties
There is a risk that the funds received to compensate for salary increases will be insufficient to cover the costs, and that the annual cost of services provided by other government departments and agencies will increase significantly. To mitigate these risks, the NSIRA Secretariat forecasts personnel and operating expenses over a period of three fiscal years, and identifies critical functions.
The NSIRA Secretariat closely monitors payroll transactions to identify and quickly correct any shortfalls or overruns. It continues to apply ongoing mitigating controls such as participation in PSPC’s Reconciliation Tool (RT) initiative. Mitigation measures for the risks described above have been defined, and are reflected in the NSIRA Secretariat’s approach and timetable for carrying out its mandated activities.
Significant changes in relation to operations, personnel and programs
There have been no changes to the NSIRA Secretariat Program.
Approved by senior officials:
Charles Fugère
Executive Director
Martyn Turcotte
Chief Financial Officer
Appendix
Statement of authorities (Unaudited)
(in thousands of dollars)
| Fiscal year 2024–25 | Fiscal year 2023–24 | |||||
|---|---|---|---|---|---|---|
| Total available for use for the year ending March 31, 2025 (note 1) | Used during the quarter ended December 31, 2024 | Year to date used at quarter-end | Total available for use for the year ending March 31, 2024 (note 1) | Used during the quarter ended December 31, 2023 | Year to date used at quarter-end | |
| Vote 1 – Net operating expenditures | 18,856 | 3,838 | 11,821 | 22,633 | 4,313 | 11,531 |
| Budgetary statutory authorities | ||||||
| Contributions to employee benefit plans | 1,601 | 400 | 1,201 | 1,755 | 438 | 1,316 |
| Total budgetary authorities (note 2) | 20,457 | 4,238 | 13,022 | 24,388 | 4,751 | 12,847 |
*Details may not sum to totals due to rounding*
Note 1: Includes only authorities available for use and granted by Parliament as at quarter-end.
Departmental budgetary expenditures by standard object (unaudited)
(in thousands of dollars)
| Fiscal year 2024–25 | Fiscal year 2023–24 | |||||
|---|---|---|---|---|---|---|
| Planned expenditures for the year ending March 31, 2025 (note 1) | Expended during the quarter ended December 31, 2024 | Year-to-date used at quarter-end | Planned expenditures for the year ending March 31, 2024 (note 1) | Expended during the quarter ended December 31, 2023 | Year-to-date used at quarter-end | |
| Expenditures | ||||||
| Personnel | 14,211 | 3,584 | 10,448 | 13,372 | 2,866 | 8,766 |
| Transportation and communications | 685 | 131 | 266 | 650 | 110 | 302 |
| Information | 76 | 15 | 28 | 371 | 1 | 5 |
| Professional and special services | 4,617 | 437 | 2,026 | 4,906 | 486 | 2,155 |
| Rentals | 309 | 40 | 82 | 271 | 78 | 151 |
| Repair and maintenance | 436 | 27 | 67 | 4,580 | 1,161 | 1,188 |
| Utilities, materials and supplies | 58 | (11) | 29 | 73 | (1) | 56 |
| Acquisition of machinery and equipment | 65 | 0 | 20 | 132 | 83 | 135 |
| Other subsidies and payments | 0 | 15 | 56 | 33 | (33) | 89 |
| Total gross budgetary expenditures (note 2) |
20,457 | 4,238 | 13,022 | 24,388 | 4,751 | 12,847 |
*Details may not sum to totals due to rounding*